The study ©Brian Har Get in touch
[ Driverless Yishun · evidence ]

How far to trust the numbers

What was checked and how it came out, what was found wrong and fixed, and the files and commands that rebuild every figure.

Scorecard

Every check, with its result

"Pass" means the check ran and met its stated criterion. "Bounded" means the question stays open but a test brackets how much it can move the answer. "Stated" means a limit is named and not tested. "Open" means the evidence disagrees or is missing.

StatusCheckResultPart
passRoad model on bus services it was not fitted toWhole services held out, five folds: 18% error in running time, against 30% for a distance-only model fitted the same way (171,838 live LTA arrival estimates, 10:00–13:00)1
passRoad model at other hoursScored without refitting on 13:00–14:59: observed ÷ predicted 1.001
passObserved bus GPS movementChained positions of the same bus, about 5 minutes apart: observed ÷ modelled time 0.99 at midday (3,355 pairs). Same feed and day as the fit, but observed positions, not LTA's estimates1
openEvening peak road speedsThe measures disagree: LTA's estimates imply buses 1.10× slower than the midday model, bus GPS shows 1.02× (95 % interval 0.98–1.07). A sensitivity case applies the evening calibration all day1
openMorning peak road speedsNot observed: live data were collected 10:00–15:00 and 17:30–19:30. The capacity threshold is set in the morning rush1
passRoad network against LTA's route distances268 consecutive stop pairs: routed ÷ published distance has a median of 1.02 (IQR 0.95–1.09); segments off by more than 40 % are left out of the calibration1
passDemand months agreeJuly and August 2026 within 0.1 % per weekday; September 3.5 % lower, as its school-holiday week predicts1
passDispatch kernel against brute forceSame optimal cost as an explicit enumeration of every insertion on 400 random schedules1
passSimulator invariantsExact times on a grid, capacity never exceeded, continuous legs, kilometres that add up, berth limits held; randomized fleets, capacities and demand (tests/test_sim.py)1
passFleet search assumptionsThe bisection assumes more vehicles never hurt: 126 evaluated fleets checked, no violations1
boundedAssumptions behind the fleetAcross 18 alternative assumptions, pushing both ways, the all-day 10-seat fleet ranges 375–550 (base 450). See the chart below1
passSame riders in every optionRide counts, rides without a bus option and today's passenger-hours are identical across options on every simulated day2
passRule C uses only what is known in advanceEligibility comes from the published timetable before anyone travels; tripling the simulated bus waits leaves the set of offered rides unchanged (tests/test_phase2.py)2
passResults rebuild from the committed runsThe summary, the page data and the results tables equal a fresh build from the run files (tests/test_phase2_outputs.py); every grid ran on a clean, committed tree2
boundedBus times on the rides C selectsC targets exactly the pairs where the modelled bus is slow, so model error there is selected for. If bus times on those rides were 20 % too high, the saving of C (θ 8 min with 175 shuttles) would fall from 6,729 to 3,911 passenger-hours a day. Checking those rides against GPS or tap-out times is the most important missing evidence2
boundedCost inputsEvery one of 36 cost parameters has a low, central and high value from a register of 247 sourced rows; one-at-a-time swings and joint low and high cases are reported (chart below)2
pass met its criterionfixed found wrong, corrected and re-runbounded open, with a test of its sizestated named, not testedopen disagreeing or missing evidence
Method

What is observed, what is modelled, what is assumed

observed Data

  • Rides between every pair of stops by hour: LTA DataMall fare-card OD, July and August 2026 (September as a check).
  • Bus routes, stop sequences, first and last buses, headway ranges: LTA DataMall (pinned copies in the repository).
  • Bus running times and headway regularity: 171,838 matched pairs of LTA's live, GPS-based arrival estimates, 15 Oct 2026, 10:00–13:00.
  • Bus GPS movement: 3,355 pairs of reported positions of the same bus a few minutes apart.
  • Every Singapore bus ride (fare-card OD), to share Yishun's bus-km between internal and other riders (Part 2).
  • Roads: OpenStreetMap, pinned extract of 22 Oct 2026. Land use and boundaries: URA Master Plan 2019. Block storeys: HDB.

modelled Model

  • Road travel time = calibrated cruise time + 15 s per signal-controlled location; bus dwell 41 s per stop (+25 s at stations). Same roads and speeds for both modes.
  • Bus wait = 0.57 × the combined headway of the lines serving a stop pair (common lines). A rider boards a looping line at whichever visit of the stop gives the shortest ride.
  • Shuttles: event-driven simulation, immediate insertion dispatch, rides within 1.6× direct + 4 min, idle vehicles reposition towards expected demand. A stop takes 20 s plus 4 s per rider (assumed).
  • Costs (Part 2): low, central and high values per parameter, from published contracts, prices and wages; vehicles bought or leased, never both.

assumed Not modelled

  • Demand held fixed: today's riders, times and stops; no fares, mode shift or induced trips.
  • No congestion feedback: hundreds of shuttles do not slow each other or the buses.
  • Bus crowding and denied boarding; riders timing their arrival with live bus information.
  • Charging (Part 2 estimates reserves, it does not simulate charging), breakdowns, staff relief, COE and registration taxes on vehicles.
The road and bus model

Fitted on live bus data, checked against bus GPS

Calibration: modelled against observed median running time for stop sequences of one to six stops (circle area: observations). The dashed line is a perfect fit.
Elapsed time between GPS positions of the same bus, divided by the model's time between those positions, pooled by hour (bars: 95 % interval over routes). 1 means the model matches what buses did. The shaded hours were used for fitting; later hours are out of sample. Nothing was collected between 15:00 and 17:30.
What moves the answers

One assumption at a time

Part 1: the fleet that keeps up with the bus all day

Smallest fixed fleet of 10-seat shuttles that keeps up with the bus in every hour on all three simulated days, when one assumption changes. The base case is the vertical line; fleets are searched on a 25-vehicle grid.

Part 2: the cost of an hour of riders' time saved

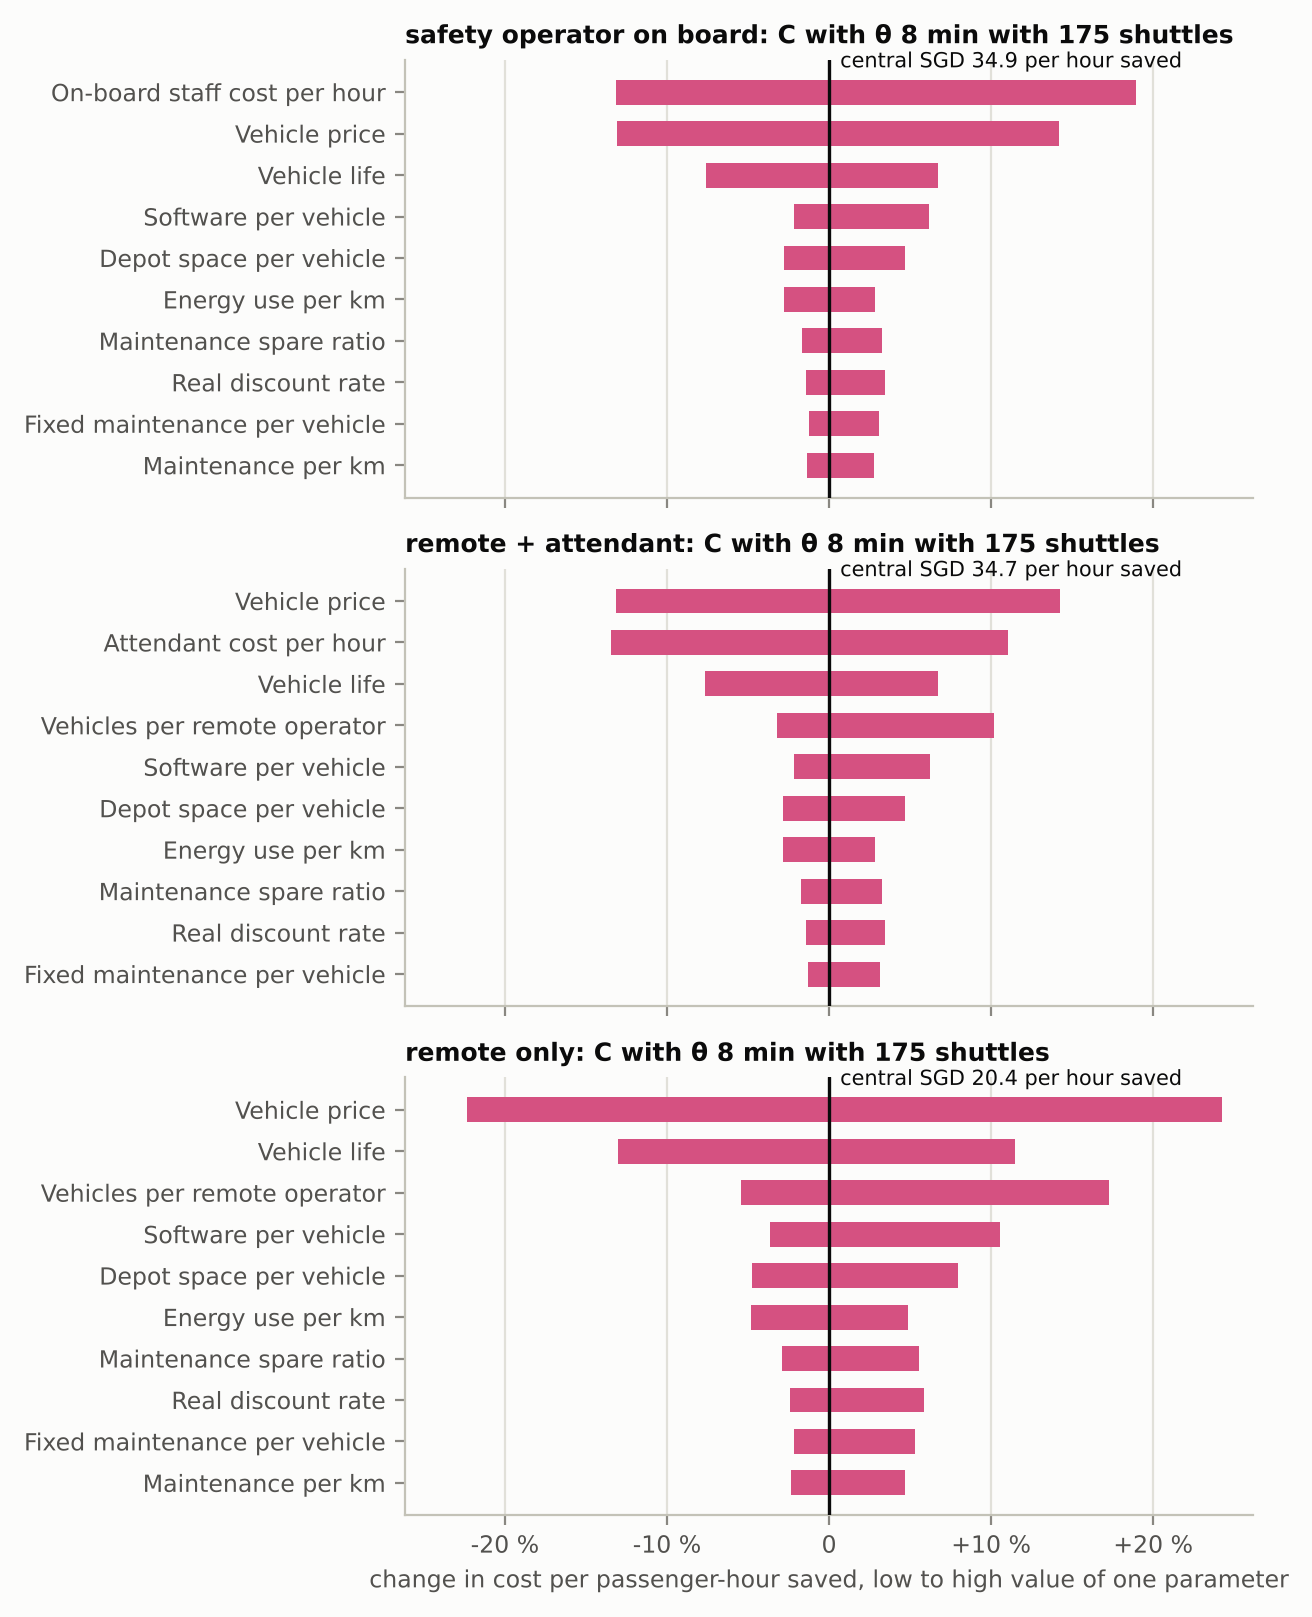
Cost per passenger-hour saved when one cost parameter moves to its low or high value, the others central, for each staffing case, as a change from that case's central value. One axis for all three, so bar lengths compare.

Part 2: the figures behind the report

The analysis charts, as drawn from the results file

These static charts are drawn with matplotlib by python -m yishun.phase2.charts from data/processed/phase2/summary.json, the same file the interactive charts read. They show the whole data set where the study page shows the headline, so a figure here can be checked against a point on the page. Select a chart to open it at full size.

Every configuration: cost against time saved

Every configuration: cost against time saved
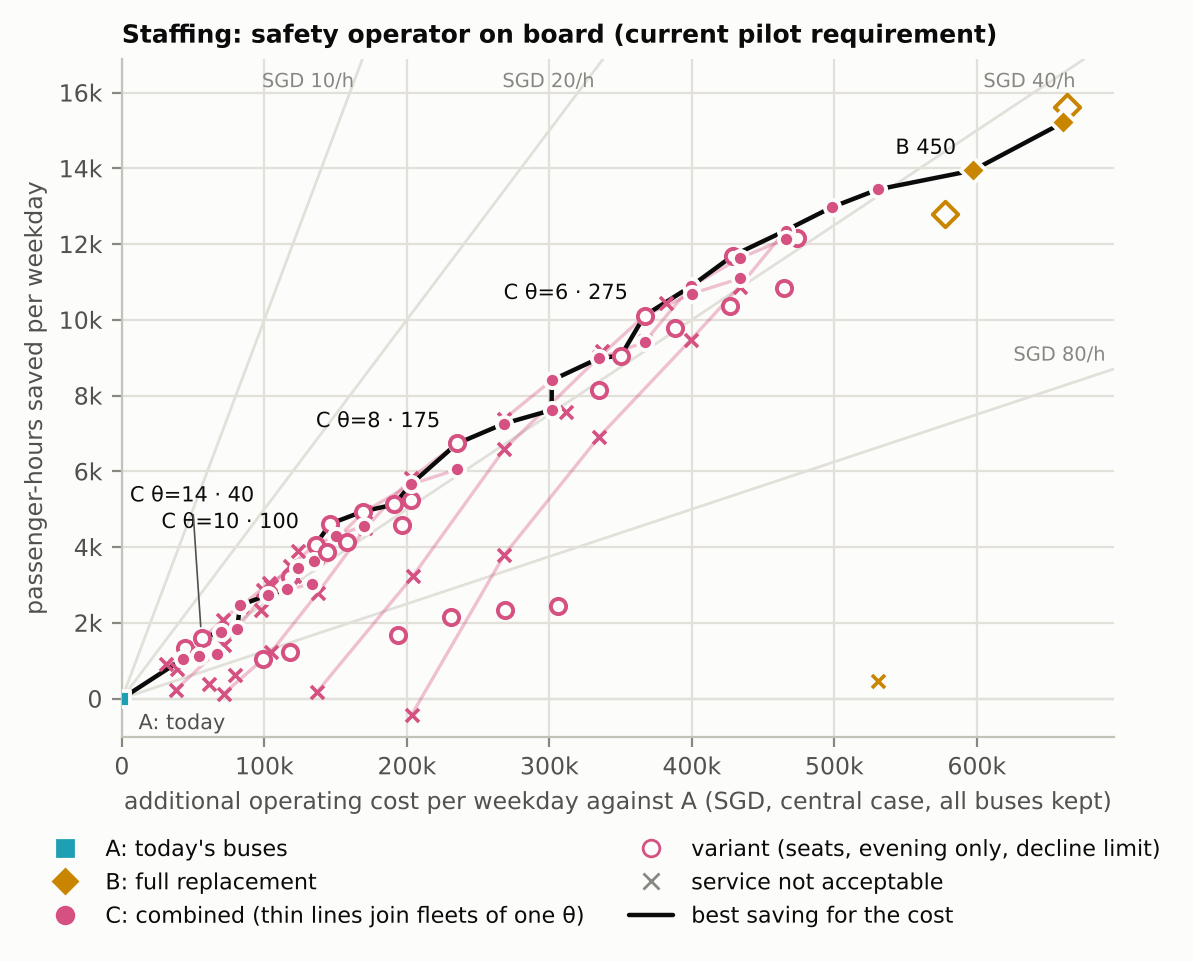
Every simulated configuration: additional operating cost per weekday against Option A (central cost case, all buses kept) and passenger-hours saved per weekday on the same rides (mean of the simulated days), with a safety operator on board (the current pilot requirement). The black line joins the configurations that save more than every cheaper one; grey rays mark constant cost per passenger-hour saved. Crosses: service not acceptable (more than 1 % of offered rides declined in some hour, or riders refused). Costs are modelled from the parameter register; times are simulated (shuttles) and modelled (buses).

The best saving for the cost, by staffing

The best saving for the cost, by staffing
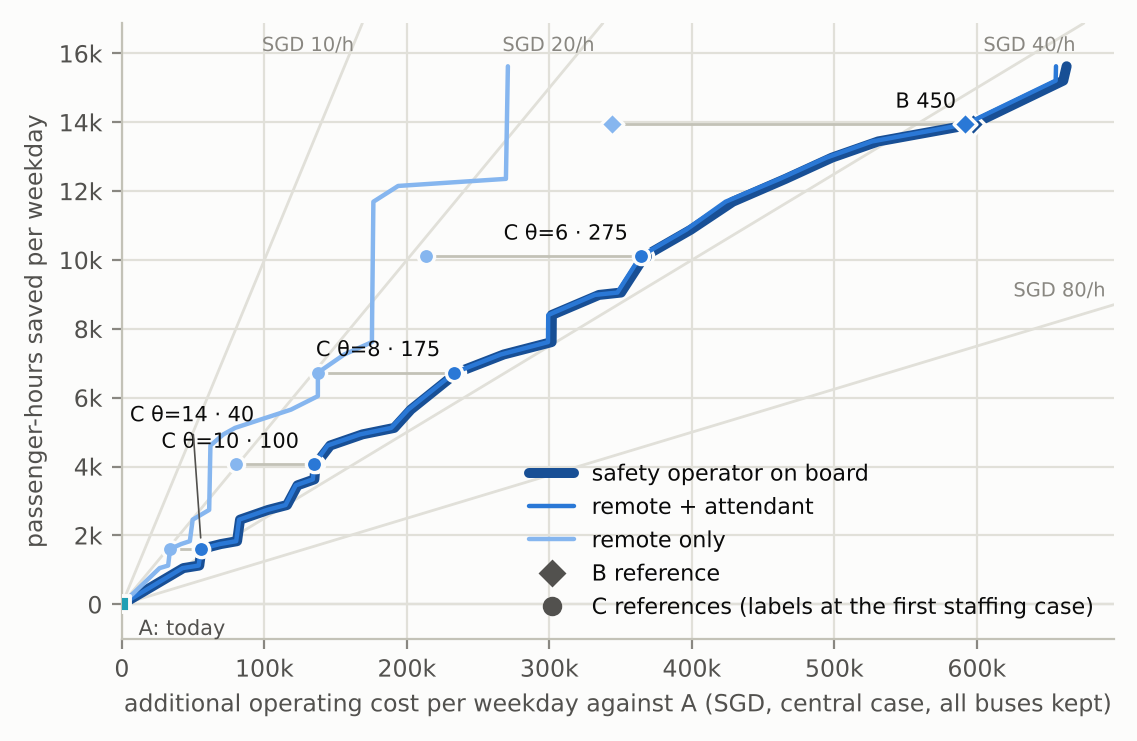
The best saving for the cost under each staffing case (central cost case, all buses kept). Passenger time does not depend on staffing, so each reference configuration keeps its height and moves left as staffing falls (grey lines).

What a budget buys

What a budget buys
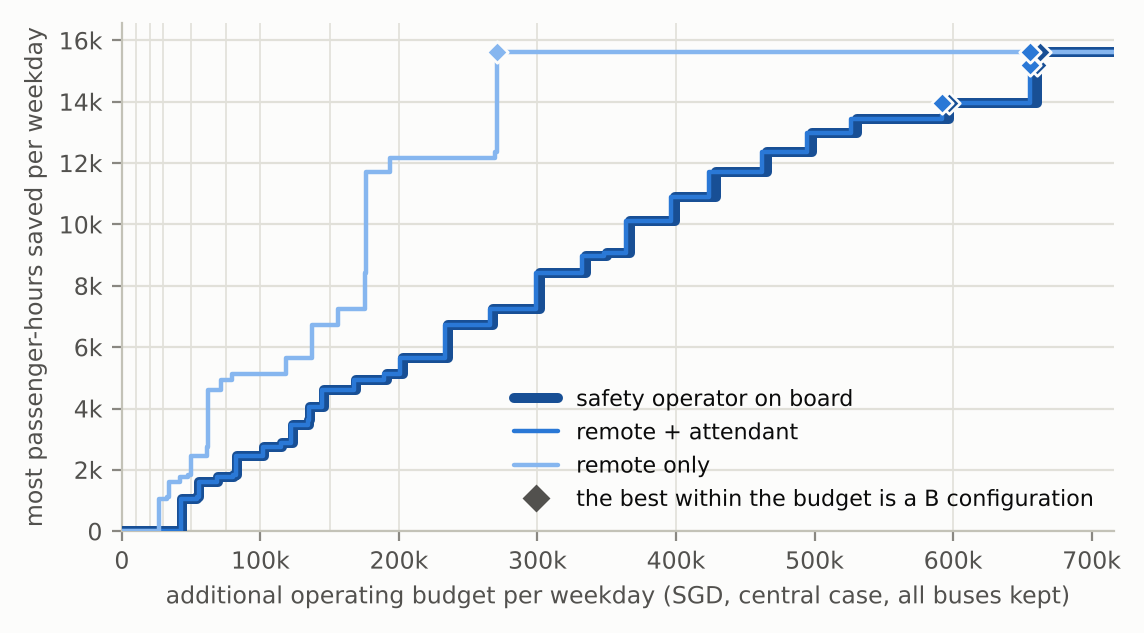
The most passenger-hours saved per weekday by any configuration with acceptable service whose additional cost (central case, all buses kept) is within the budget, for each staffing case; diamonds mark where the best is a B configuration (elsewhere it is a C configuration). Faint vertical lines: the budgets of the report's budget table. There is no single acceptable cost.

Where the shuttle cost goes

Where the shuttle cost goes
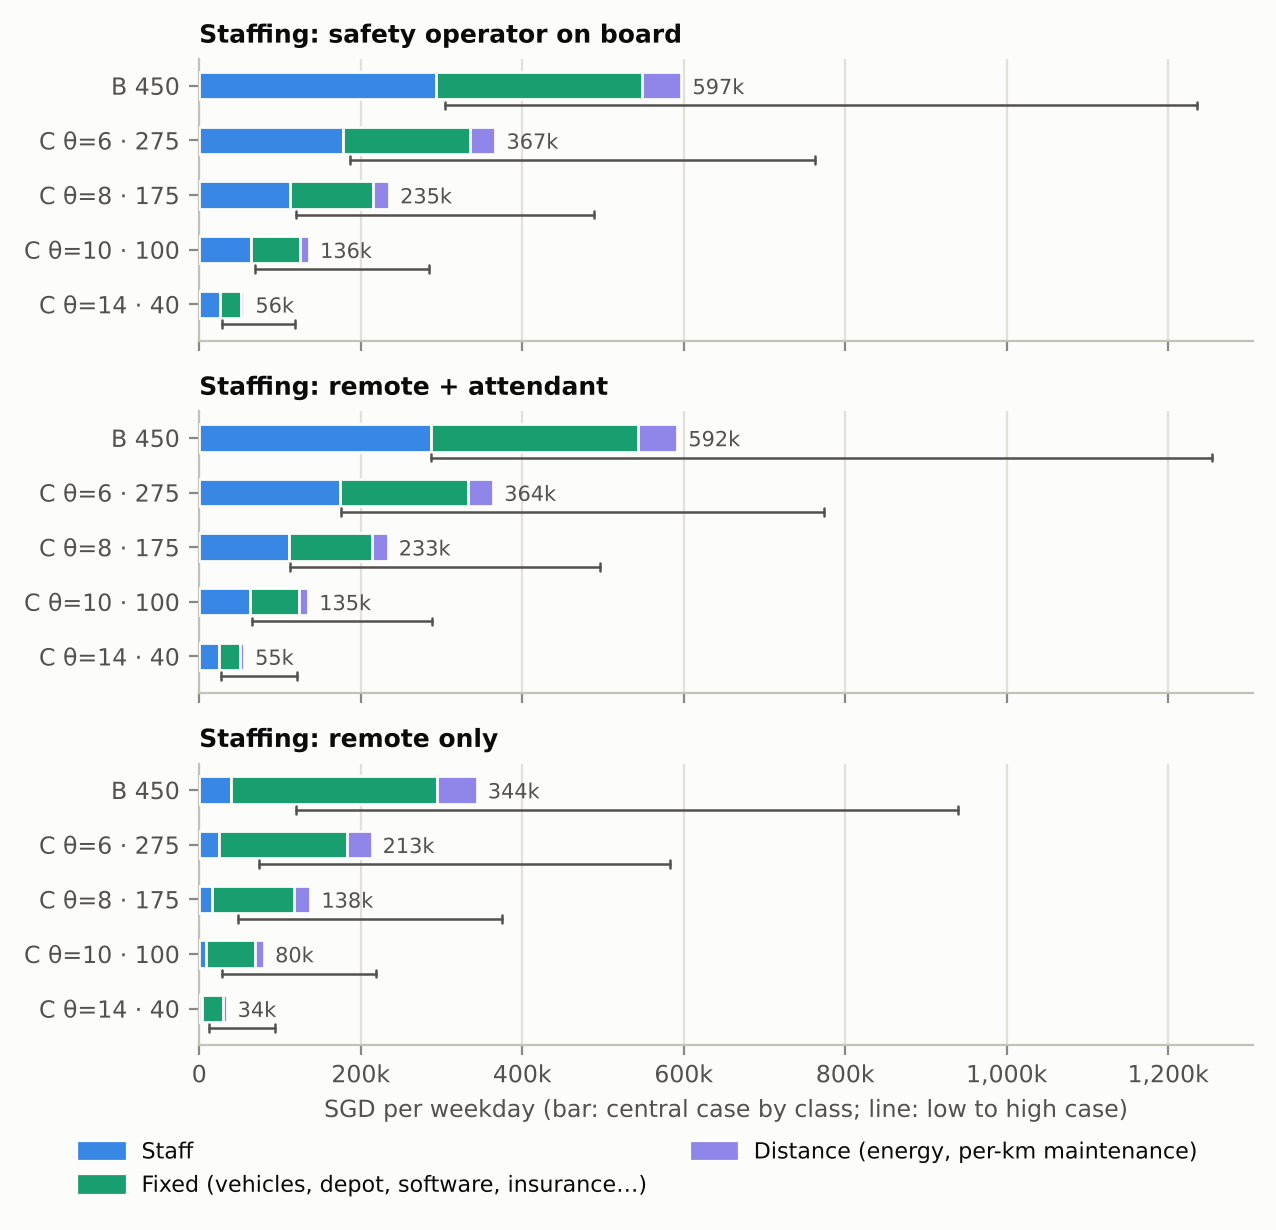
Shuttle operating cost per weekday by class for the reference configurations, central case (bar) and low-to-high cost cases (line), for each staffing case.

Passenger time, waiting and in vehicle

Passenger time, waiting and in vehicle
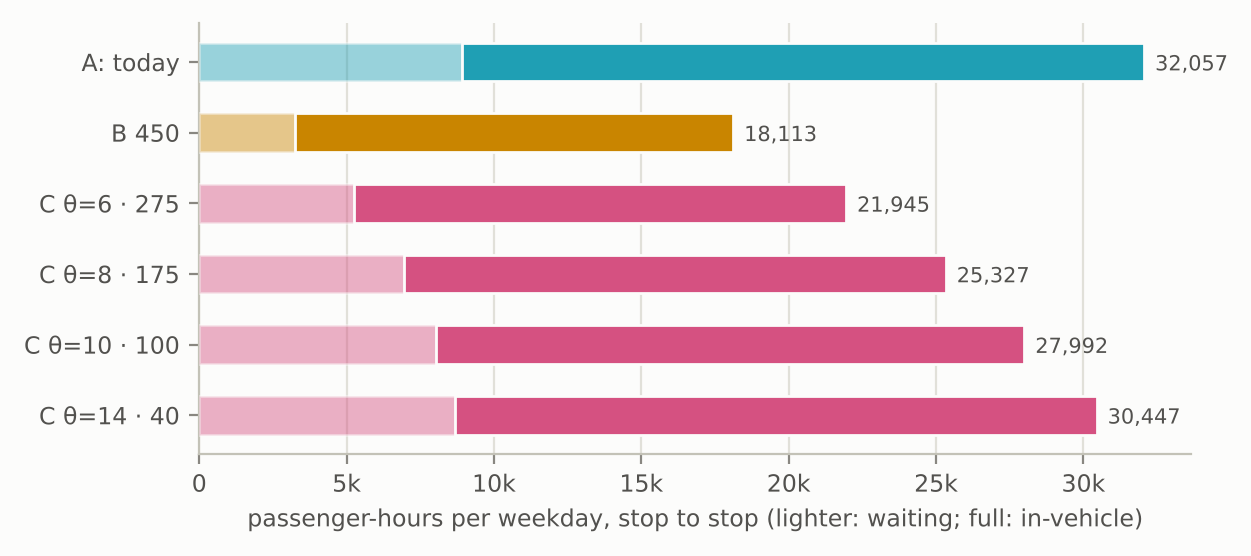
Passenger-hours per weekday on the same rides, stop to stop: waiting (lighter) and in-vehicle (full). Bus times are modelled; shuttle times are simulated.

When the time is saved

When the time is saved
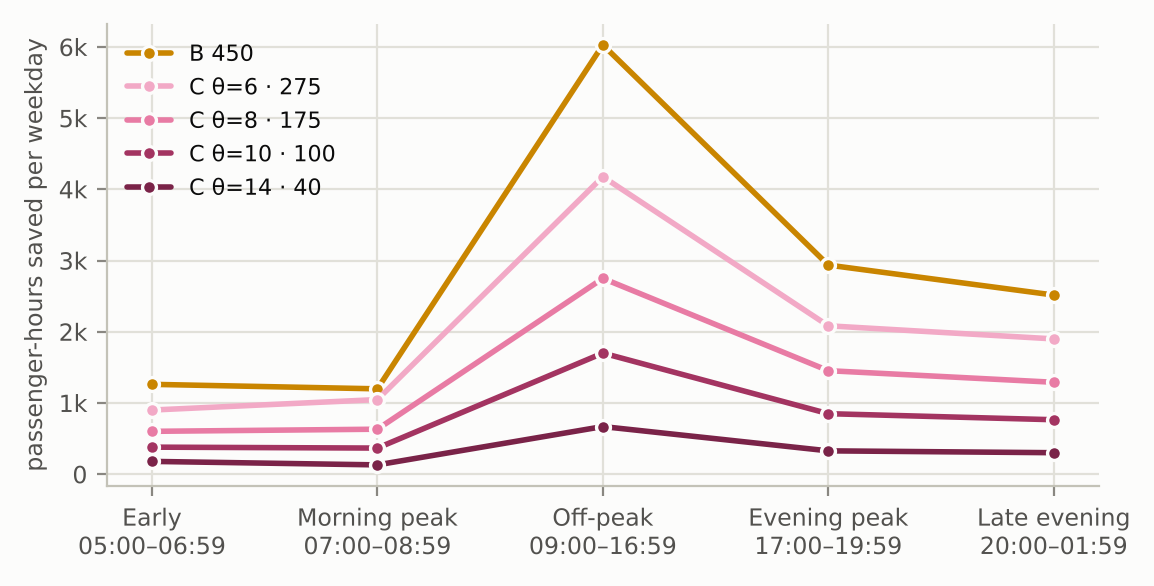
Passenger-hours saved per weekday against Option A, by the period in which the ride is requested (sums over the period).

Which cost parameters move the answer

Which cost parameters move the answer
Cost per passenger-hour saved when one cost parameter at a time moves to its low-cost or high-cost value (the others central), for the focus C configuration of each staffing case; the ten widest swings.
Part 2 · independent review

Nine findings, and what was done about each

Part 2 was reviewed by a reviewer who had not built it, who read the code and outputs, recomputed costs by hand, rebuilt the summary and re-ran a recorded simulation. Every result on the study page comes from the runs made after these fixes.

StatusFindingWhat was done
fixedR1 · material. The bus model boarded riders at the first visit of a stop on a line. Feeder 812 is a figure of eight through Yishun Interchange, so a rider for its second loop was timed riding the first loop as well: today's bus times were too long on exactly the rides the combined service selects.Riders board at whichever visit gives the shortest ride, tested on a figure-of-eight line and checked against brute force on every real line that revisits a stop. Model, both parts' experiments and every table re-run.
fixedR2 · material. "The combined service buys time more cheaply than any full replacement" holds only with every bus kept.The claim is qualified, and full replacement with the internal-only services withdrawn is reported with its cost per hour saved.
fixedR3 · material. The stress tests compared two service designs: full replacement accepted 45-minute pickups with no bus to fall back on, the combined service declined after 15 minutes and the rider took the bus.Every stress now also runs full replacement under the combined service's rule; the base row uses the same three days as the stress rows; "realistic kerb limits" became test values.
statedR4. No rider times their arrival with live bus information.Added to the limits; the reviewer's first-order estimate is that savings fall by about a fifth if only bus riders did.
statedR5. No relief or spare staff; unlimited kerb in the base case.Added to the limits; a 10–15 % relief factor would add about 4–7 % to on-board costs without changing the ranking.
fixedR6. The full bus cost per bus-km may count LTA's assets twice.Avoidable bus cost reported at the full cost and at the operator fee only.
fixedR7. LTA's route, service and stop files were not pinned.Committed with checksums; make data restores them.
fixedR8. Report statements stronger than the outputs, one of them wrong (4-seat vehicles are also cheaper per hour with an operator on board).Report rewritten from the re-run results.
fixedR9. Defects in generated tables and charts (blank subzone names, an axis showing 7,500 as "8k").Fixed in the generators.

The review in full: docs/phase2/review.md. Part 1's own red-team reviews and their fixes: docs/validation.md.

Limits

What the model leaves out, and whom that flatters

LimitFlattersHow it is handled
Morning-peak road speeds not observeduncertainEvening-peak calibration all day as a sensitivity case
No congestion feedback: added shuttles slow nothingshuttlesSpeed stresses (slower roads; shuttles 25 % slower) bound it; not a congestion model
Unlimited kerb space in the base caseshuttles, most of all full replacementKerb limits of 10 and 7 shuttles per station tested (test values)
Demand fixed: no riders attracted by faster trips, no fare effectsuncertainStated; time savings never counted as revenue
Bus crowding and denied boarding not modelledbusesStated; the combined service's relief of crowded buses is not counted
Riders do not time their arrival with live bus informationshuttlesStated in Part 2; Part 1 tests arrival-app riders
Simple dispatcher with exact travel timesbuses (a better dispatcher needs fewer vehicles)Wider dispatcher searches tested: 375–400 vehicles instead of 450
A fixed fleet in service all daybuses (raises shuttle cost)Hourly fleet needs reported as lower bounds
Remote supervision without anyone on board is not permitted todayshuttles, in the remote casesThree staffing cases reported separately, today's requirement first
Vehicle prices without COE and registration taxesshuttles, most of all 4-seat vehiclesStated; listed as evidence needed

Every limit of Part 2, with its treatment: docs/phase2/limits.md.

Data files

Every number on the site, as files you can open

Raw LTA files are not redistributed, except the three static bus files the results depend on. Everything derived is in the repository.

FileWhat is in itFormat
results.jsonPart 1: every figure, curve and table on the study page, with the provenance of the experimentsJSON
phase2.jsonPart 2: every configuration's time, cost and service, per staffing and cost caseJSON
summary.jsonPart 2: the full summary the page and report are built fromJSON
phase2/<grid>/runs.parquetPart 2: one row per simulated day (510 in all, stress tests included), with hourly and group tables beside itParquet
internal_od_202607_202608.csv.gzObserved demand: average-weekday rides between every pair of Yishun stops by hourCSV
calibration.jsonFitted road speed, signal delay, bus dwell and headway regularity, with bootstrap intervalsJSON
gps_check.jsonObserved bus GPS movement against the modelJSON
cost_cases.json · cost_register.csvPart 2 cost parameters (low, central, high) and the 247 sources behind themJSON, CSV
lta/ · osm/Pinned LTA bus stops, services and routes, and the OpenStreetMap extract, with checksumsxz

Sources and licences

DatasetProviderUsed forLicence
Passenger Volume by Origin Destination Bus Stops (July, August, September 2026)LTA DataMallObserved demand; who uses Yishun's busesSingapore Open Data Licence v1.0
Bus Stops, Bus Services, Bus Routes; live Bus Arrival (v3)LTA DataMallBus network; calibration; GPS checkSingapore Open Data Licence v1.0
HDB Property Information; HDB Existing BuildingHDB via data.gov.sgBlock heights and footprintsSingapore Open Data Licence v1.0
Master Plan 2019 planning areas, subzones, land useURA via data.gov.sgStudy area; base mapSingapore Open Data Licence v1.0
Census of Population 2020, residents by subzone and ageSingStat via data.gov.sgAge profileSingapore Open Data Licence v1.0
Roads, signals, buildings, railOpenStreetMap contributorsRoad network; contextODbL 1.0
Reproduce

Rebuild every number from the raw data

With a free LTA DataMall key in LTA_DATAMALL_KEY. The live bus data of 15 October 2026 cannot be downloaded again, so the calibration fitted on it is committed and used; DataMall serves fare-card months for three months only, so the Yishun OD table is committed too.

make setup                    # Python 3.12 environment, pinned packages
make data                     # LTA, data.gov.sg; restores the pinned OSM and LTA bus files
make reproduce-core-results   # Part 1: experiments, sensitivity, page data, tests (about 2.5 h on 4 cores)
make phase2-allocation        # Part 2: who uses Yishun's bus-km (needs the July and August OD files)
make phase2-experiments       # Part 2: options A, B and C on shared simulated days (about 1.5 h)
make phase2-results           # Part 2: summary, page data, report charts and results tables
make web && make serve        # this site at http://localhost:8000

What these results were built from

Part 1—
Part 2—